What Direction Will Housing Prices Go?

Which markets do you think will have price increases, decreases or those that will stay flat?
Many are talking about this topic and there are several variables to consider.
Home buyers are particularly concerned because they don’t want to buy and receive negative equity right after purchasing their property.
So, how will anyone determine the direction of price variations going forward?
Today, we will review a few topics that can help your gain insight on the potential direction of housing prices by state.
Let’s get started.
Demand

Demand is a considerable factor in this equation.
Demand is the one leading factor that everyone seems to miss when they talk about home prices.
There is so much emphasis being placed on the fed raising rates, that people who aren’t as knowledgeable, are confusing the primary factor, which has caused this rapid growth in home prices.
Supply has been, and is the primary factor, in why home prices rose so rapidly.
Yes, low interest rates fueled the demand.
However, if inventory wasn’t a concern, we would not be discussing rapid home price growth in short periods of time.
- If demand in a particular state is high and the inventory is balanced, price growth can still happen and become a more favorable market for sellers.
- In states that have less demand, and the inventory is balanced, prices can decline and become a more favorable market for buyers.
These are important factors to understand when looking at the projections we will discuss later in the article.
You will see specific states that show wider variance due to the specific sentiment in demand in that state.
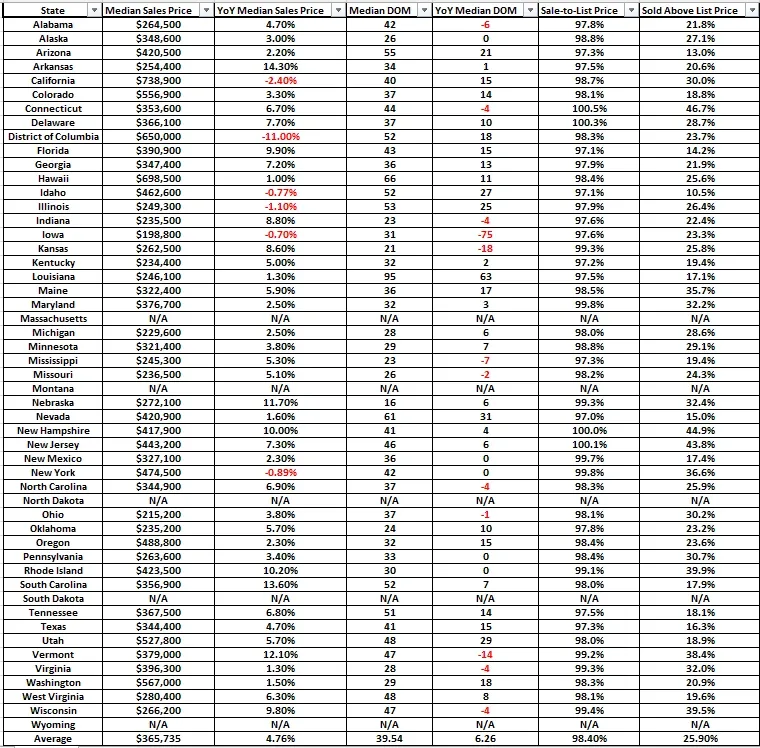
- Iowa – Year over year median sales price declines – low inventory, but lower demand although low price points.
- California – Year over year median sales price declines – low inventory, but lower demand due to high price points.
- Idaho – Year over year median sales price declines – low inventory, but lower demand due to high price points.
- Illinois – Year over year median sales price declines – low inventory, but lower demand due to outward migration.
Interest Rates

Interest rates have played a major role in the amount of housing transactions over the last few years.
Prior to COVID, and during COVID, we experienced rates of borrowing that we may not see again for a very long time.
As the fed raises rates, the cost of borrowing increases. This directly affects affordability.
So, as mortgages become more expensive, even though the house price hasn’t changed, the demand decreases due to overall cost.
Slowly, but surely, demand drops so that supply doesn’t continue to be as high of a concern.
- It is important to know that, altering the demand and saving people from buying, we are actually mitigating the possibility of a deeper recession.
- Housing makes up over 30% of the consumer price index.
- Raising rates and reducing demand, saves the country from seeing larger deficits in times of recession.
We covered in a prior article on 3/6/22, titled Housing Market Predictions, where we indicated our estimation on when buyer sentiment would be most affected based upon interest rates.
- Our estimation was at 5% – 6% mortgage interest rates, where buyers would begin to drop out of the market.
Since that time, we have seen demand dip on a national level by about 15%.
Interest rates will continue to play a key role in buyer demand.
Provided rates stay over 6%, the estimations mentioned next are our predictions.
Housing Price Directions By State

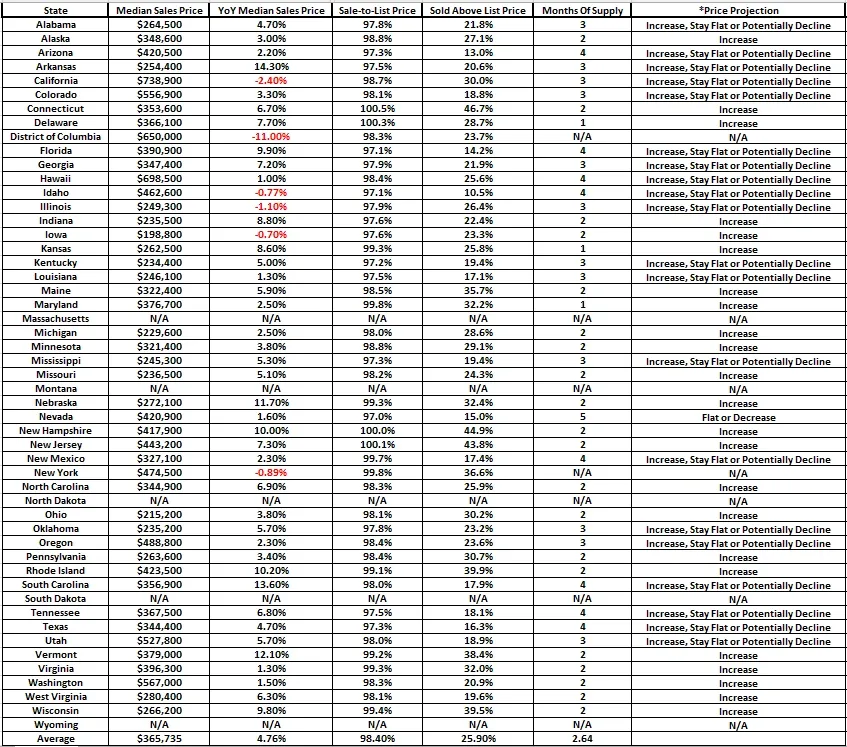
See the following chart of where we expect prices to trend, based upon the amount of inventory the state currently has as of November 2022, courtesy of data pulled from Redfin.com.
Based upon the data, we see the highest potential for prices to keep rising based upon these states’ level of months supply, are as follows.
- Delaware – 1 month of supply
- Kansas – 1 month of supply
- Maryland – 1 month of supply
Based upon the data, we see the highest potential for prices to begin declining based upon these states’ level of months supply, are as follows.
- Nevada – 5 months of supply
In the chart below take note of the current price direction and consider the factors discussed previously in the article.
If a demand variable has a high effect, that could be in either direction based on the state, you will see a projection where “increase”, “stay flat” or “decline”, may be expressed all together.
- In the Price Projection column, we’ve included our sentiment based on the data currently available.
Note: If a state shows N/A, the data was not available.
Price Projections by State

Thanks for joining us today faithful readers – future leaders.
Love ya and continue to strive for growth.
Please comment your predictions.
FREE Deal Analysis for Rental Property Calculator!
Our mission is to help others develop using our knowledge and services.
We cater to those looking to grow professionally.
Explore our tools, education and services.
