How Current Housing Data Will Affect Future Sentiment

Would you like a snapshot of what’s going on today and where the housing market is going?
We all know that renting is going to be very prevalent for a long time due to the housing supply shortage.
However, with high rental demands, inflation, the possibility of a recession, supply chain issues and several other factors, it’s important to assess projections.
Today, we will cover a few assessments based upon current day facts and predictions.
Let’s get started.
Sentiment

We have already expressed our viewpoint on the best options for homebuyers which is to buy new builds or fixer uppers in the right locations.
- Check out our article called Solutions for Home Buyers in Today’s Market.
- We also have a Home Buying Investment Calculator used to prepare for the full financial aspect of home buying with our investment calculator here. Check it out.
But, with such low level inventory, we know many buyers will need to wait until new homes are built and supply is much better.
When these new homes enter the market, we can expect that the current or older homes could begin to decline in value based upon what the sold price of the brand new homes will be.
- If the income level of the local demographic supports a selling price for the new homes, having a high enough variance from the sold price of the older homes, perhaps older home values will not be affected.
- But, if the current home sold prices are close to what the new homes will need to be sold for, (due to the median income levels of the current demographic), then older homes will decline in value. We know a new build will not compare in value to a 20, 40, or 60 year old home.
This is just one long term perspective that can be expected. But, we really don’t know when these new homes will enter the market and where they will be located.
Proximity of the new homes to other communities will matter.
So, let’s look at the current outlook on homes being built or underway of being built. We will use Census.gov for this data.
Today’s Data

From the census bureau the following is shown.
Data below is for PERMITS compared to last year shows as being:
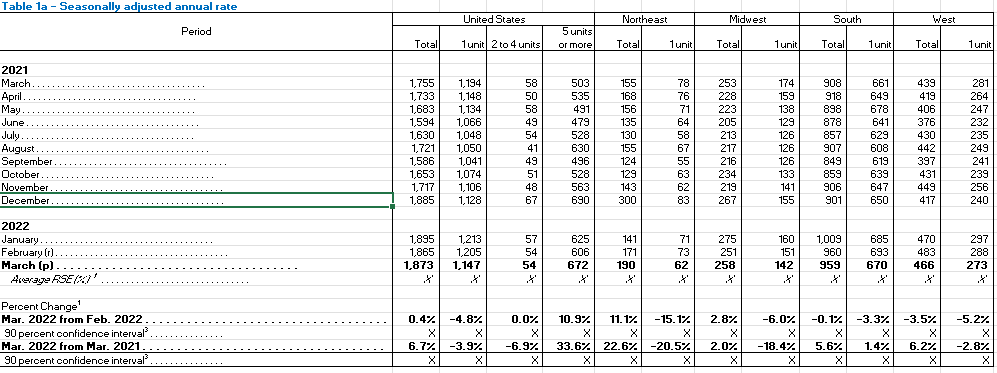
- Single family units are 3.9% down from last year for the U.S.
- New 2-4 units are 6.9% down for the U.S.
- New 5 units or more, are 33.6% up for the U.S.
- Single housing units are 20.5% down in the Northeast, 18.4% down in the Midwest, 1.4% up in the South and 2.8% down in the West.
From this data we can see that no new ambition for home building has taken off except for multifamily – 5 units or more.
– Data below is for AUTHORIZED BUT NOT STARTED work compared to last year shows as being:
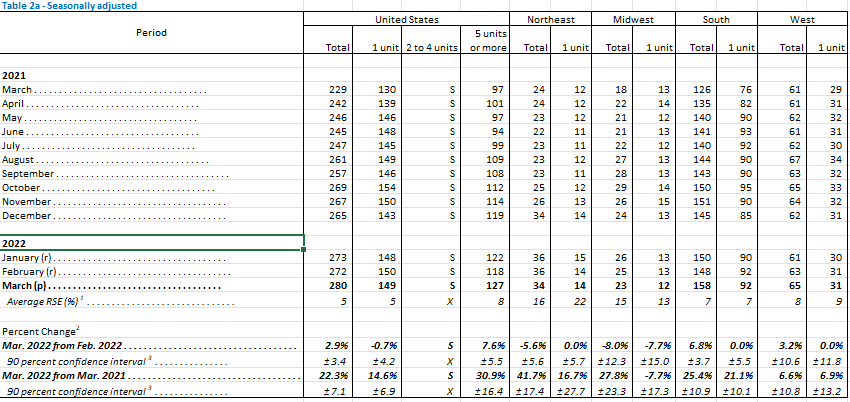
- Single family units are 14.6% up from last year for the U.S.
- No record for 2-4 units due to data not meeting publication standards because tests for identifiable and stable seasonality do not meet reliability standards.
- New 5 units or more, are 30.9% up for the U.S.
- Single housing units are 16.7% up in the Northeast, 7.7% down in the Midwest, 21.1% up in the South and 6.9% up in the West.
From this data we can see that some planning has begun for primarily multifamily and some single family. There is weighted planned productivity in the Northeast, Midwest and South. With the South having the most planned for single family versus multifamily.
Data below is for STARTED work compared to last year shows as being:
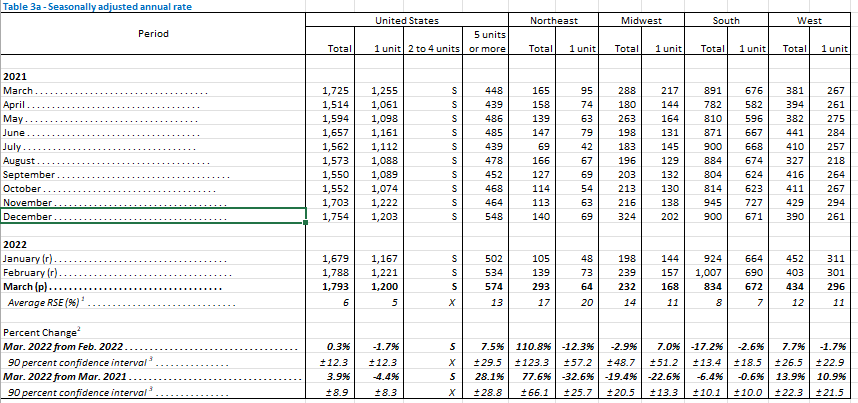
- Single family units are 4.4% down from last year for the U.S.
- No record for 2-4 units due to data not meeting publication standards because tests for identifiable and stable seasonality do not meet reliability standards.
- New 5 units or more, are 28.1% up for the U.S.
- Single housing units are 32.6% down in the Northeast, 22.6% down in the Midwest, 0.6% down in the South and 10.9% up in the West.
From this data we can see no new work has started except for multifamily in the Northeast and single family, with a small portion of multifamily, in the West.
Data below is for work UNDER CONSTRUCTION compared to last year shows as being:
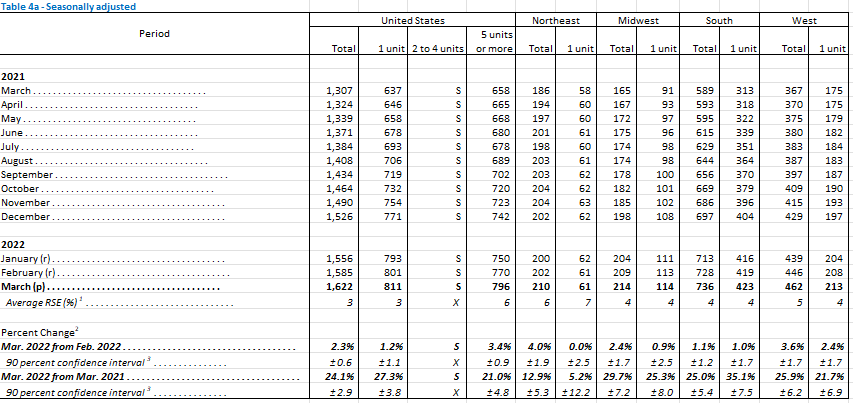
- Single family units are 27.3% up from last year for the U.S.
- No record for 2-4 units due to data not meeting publication standards because tests for identifiable and stable seasonality do not meet reliability standards.
- New 5 units or more, are 21.0% up for the U.S.
- Single housing units are 5.2% up in the Northeast, 25.3% up in the Midwest, 35.1% up in the South and 21.7% up in the West.
From this data we can see that previously started work that is under construction is higher everywhere than it was this time last year.
Data below is for work COMPLETED compared to last year shows being:
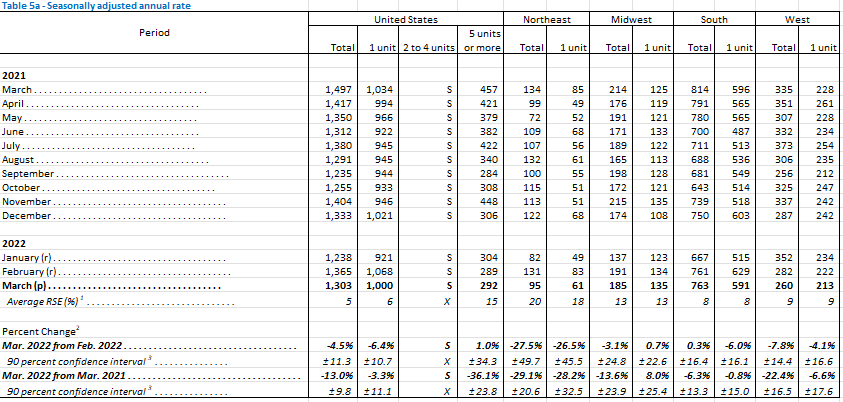
- Single family units are 3.3% down from last year for the U.S.
- No record for 2-4 units due to data not meeting publication standards because tests for identifiable and stable seasonality do not meet reliability standards.
- New 5 units or more, are 36.1% down for the U.S.
- Single housing units are 28.2% down in the Northeast, 8% up in the Midwest, 0.8% down in the South and 6.6% down in the West.
From this data we can see that completed work is under performing everywhere compared to this time last year.
Conclusion
We can see that most of the work is initiated in multifamily with some outliers for single family construction in certain parts of the country.
Although we can expect many changes over the next 6 months, many variables like inflation, supply chain, COVID-19 and labor fulfillment will play instrumental roles in our progress.
These are some good data points to be aware of.
As work does sets sail, it will be interesting to see where the volume of building occurs most.
We know the sunbelt has been popular as many people are relocating there.
It also will be interesting to see how many multifamily homes are built and what the sentiment becomes as single family homes begin being built as well.
Hopefully multifamily is not over-developed and new home prices are priced accordingly for the income levels of their communities.
Thanks for joining us today faithful readers – future leaders.
We wish you great success. Love ya and continue to strive for growth.
Please comment your thoughts on this article and what you think about future projections.
FREE Deal Analysis for Rental Property Calculator!
Our mission is to help others develop using our knowledge and services.
We cater to those looking to grow professionally.
Explore our tools, education and services.
