How Population Trends and the Path of Travel Will Affect Real Estate

As an real estate investor, are you evaluating the path of travel?
Where people are moving to, and where people are leaving from, does matter.
Population increases and decreases tell a story.
So, where do you think people are moving to and moving from in the last decade?
Today, we will use data from 2010 to 2020 to see what this path of travel tells us.
Let’s get started.
Moving Trends

Since the pandemic, we know Florida has been a hot spot. Overall the sunbelt states; California, Nevada, New Mexico, Texas, Louisiana, Mississippi, Alabama, Georgia, Florida, South Carolina and a portion of North Carolina, make up these states. I’d like to make an honorary mention for Tennessee as well.
Being that the south is not known for its dense cities, we all know that the south generally gives you more land for your money. Many people, desire to retire to the south, not only for the warm weather, but also for the land and possible cost of living savings.
- In particular, Florida, Nevada, Tennessee and Texas have no income taxes. So, we know why these could be hot spots.
Although, Alaska, New Hampshire, South Dakota, Washington and Wyoming also share this incentive, the warm weather does not come with these options.
Keep this in mind if you want to benefit from no income taxes and the warm weather is not a ‘make or break’ for you.
Investor Friendly

Also, as an investor, it is widely observed which states are more landlord-friendly and/or have lower property taxes.
The following states are deemed landlord friendly due to the eviction process, landlord/tenant laws, rent control, registration/licenses, taxes/insurance, competition and regulations after COVID-19.
- Texas
- Indiana
- Colorado
- Alabama
- Arizona
- Florida
- Illinois
- Pennsylvania
- Ohio
- Georgia
- Kentucky
While we’re at it, let’s review the states that have the lowest property taxes.
- Hawaii (0.31%)
- Alabama (0.37%)
- Louisiana (0.51%)
- Wyoming (0.51%)
- Colorado (0.52%)
- West Virginia (0.53%)
- South Carolina (0.53%)
- Utah (0.56%)
- Delaware (0.59%)
- Arkansas (0.61%)
Getting to the Data

So, after review, we have aligned a few significant factors for any investor.
Within this detail, we now need to observe where people are going and where people are leaving. We will see if any similarities pop-up from the details we’ve already shared.
From census data from Census.gov, we have pulled the following information.
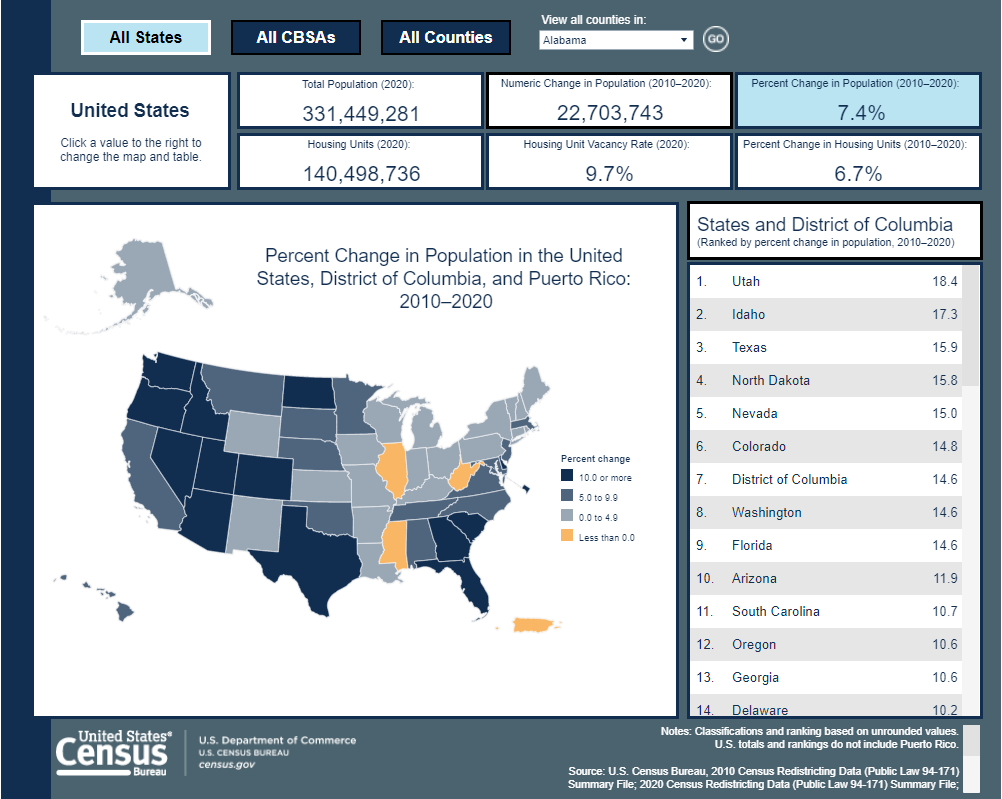
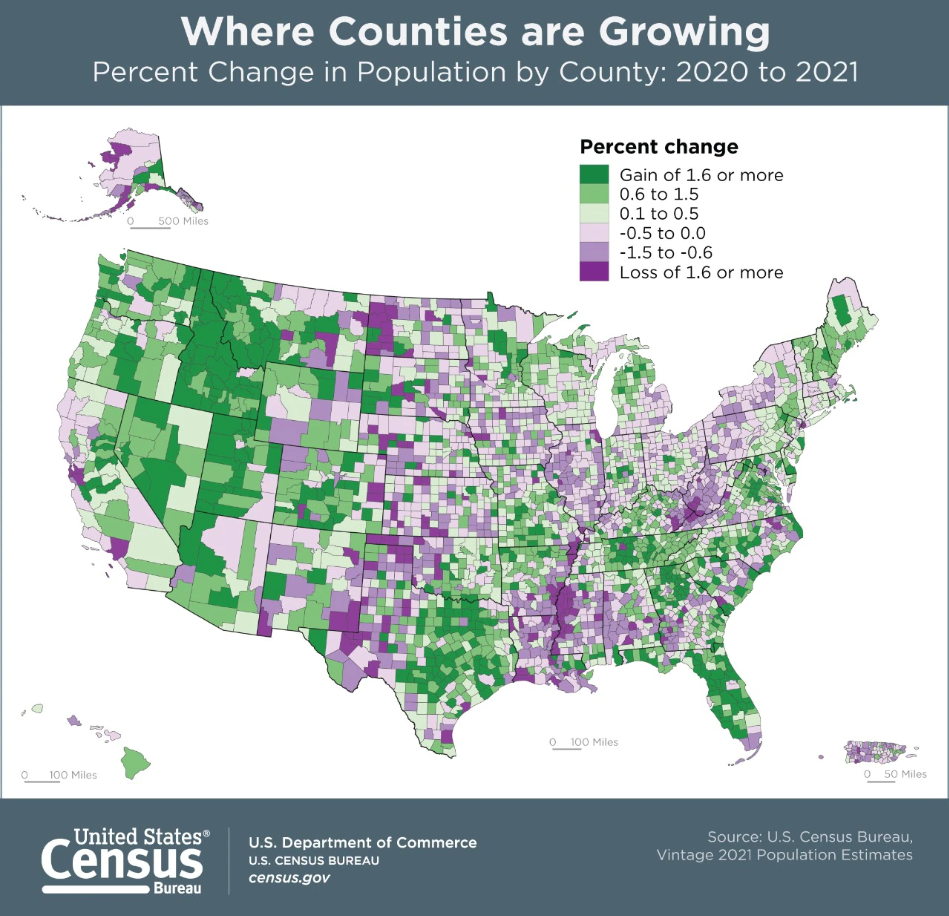
From the graph below we can see that the top five states people moved to between 2010 and 2020 are; Utah, Idaho, Texas, North Dakota and Nevada.
The states in orange, show what states have had declining populations. The declining population indicates that more people have left the state versus moving in.
States (or providences) with declining populations are Puerto Rico (-11.8%), West Virginia (-3.2%) Mississippi (-0.2%) and Illinois (-0.1%).
States with Increasing Populations from 2010 to 2020
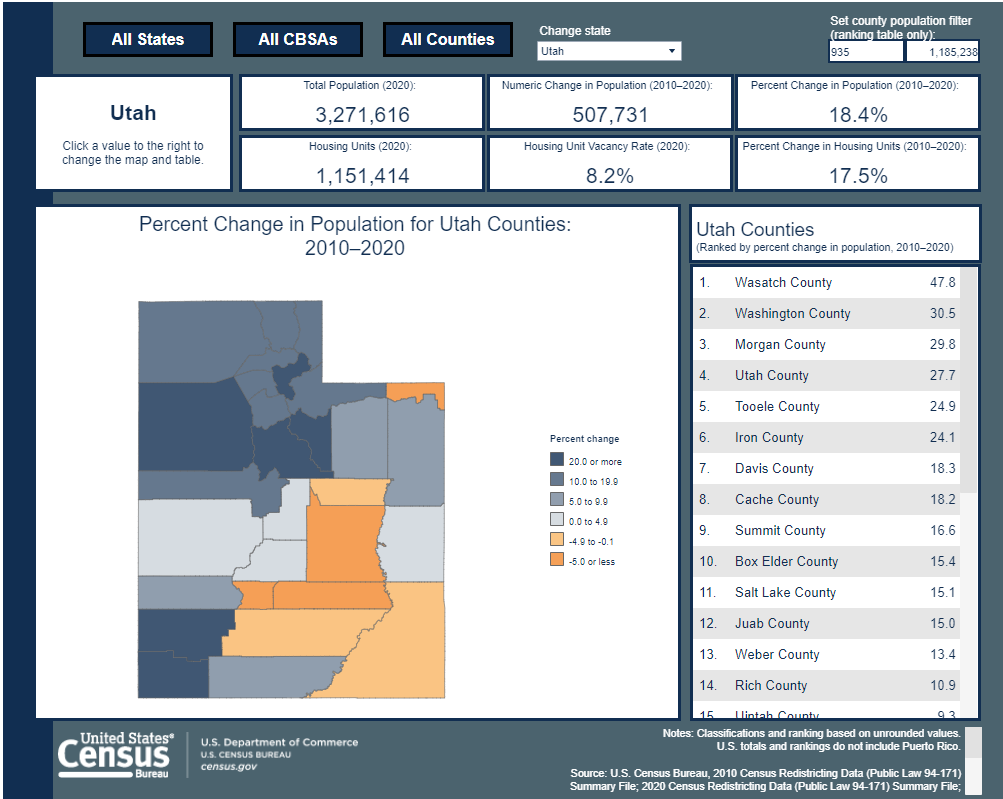
Now, let’s check on the county level for each of the top five states.
1. Utah’s Top Counties
- Utah Incentives – 4 seasons, beautiful mountains/wildlife, national parks, low property taxes, high ranking higher education, recreation, safety, great economy and low unemployment.
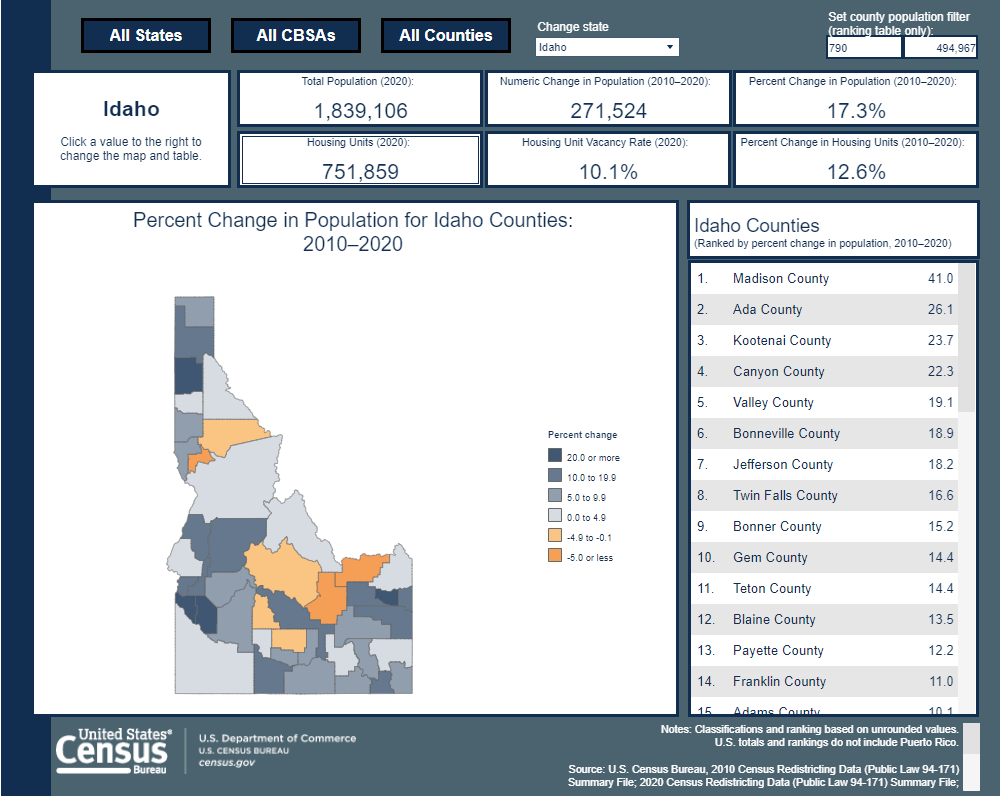
2. Idaho Top Counties
- Idaho Incentives – 4 seasons, low taxes, outdoor recreation, safety, cost of living, more land for your money, job market/employment, gardening/farming and low commute times.
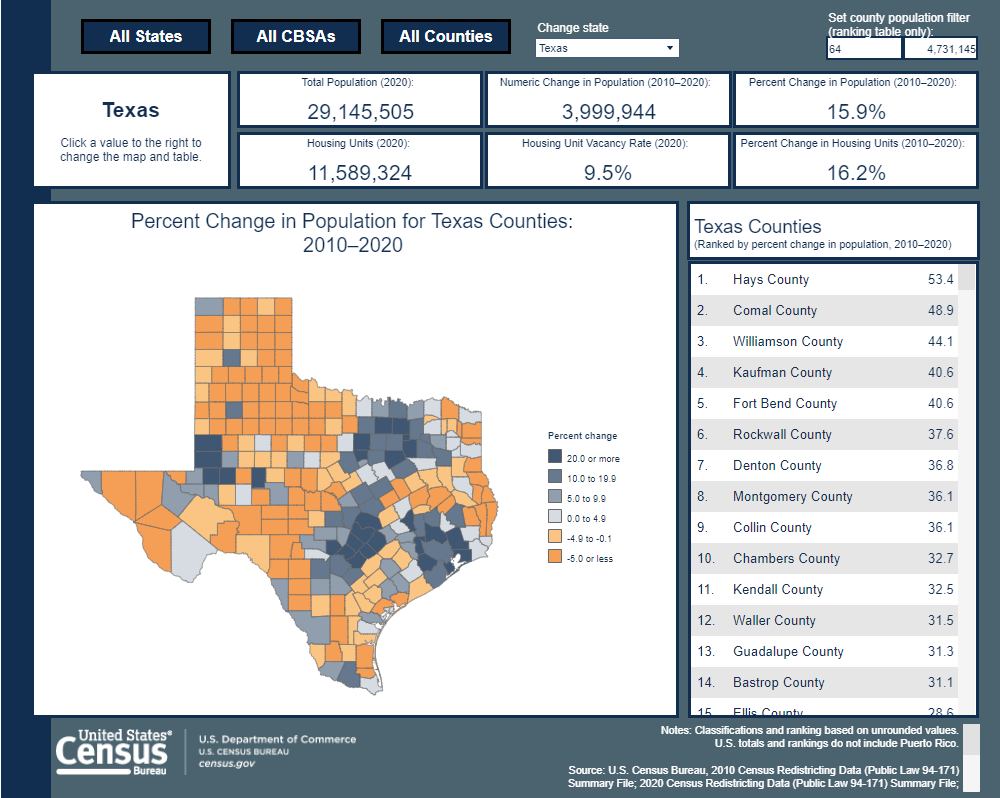
3. Texas Top Counties
- Texas Incentives – low home prices, warm weather, employment, strong economy, great schools, no income tax, year round outdoor activities, great food, diversity and land availability.
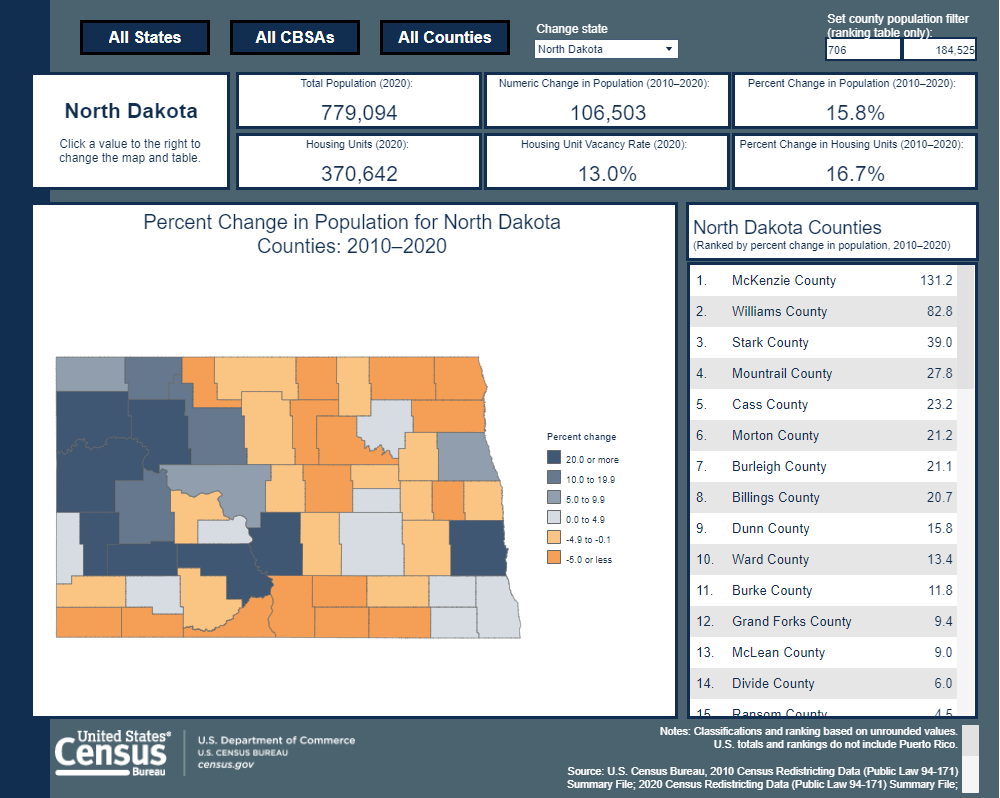
5. North Dakota Top Counties
- North Dakota Incentives – Low taxes, land availability, employment, beautiful skyline, low commute times, education and low utility costs.
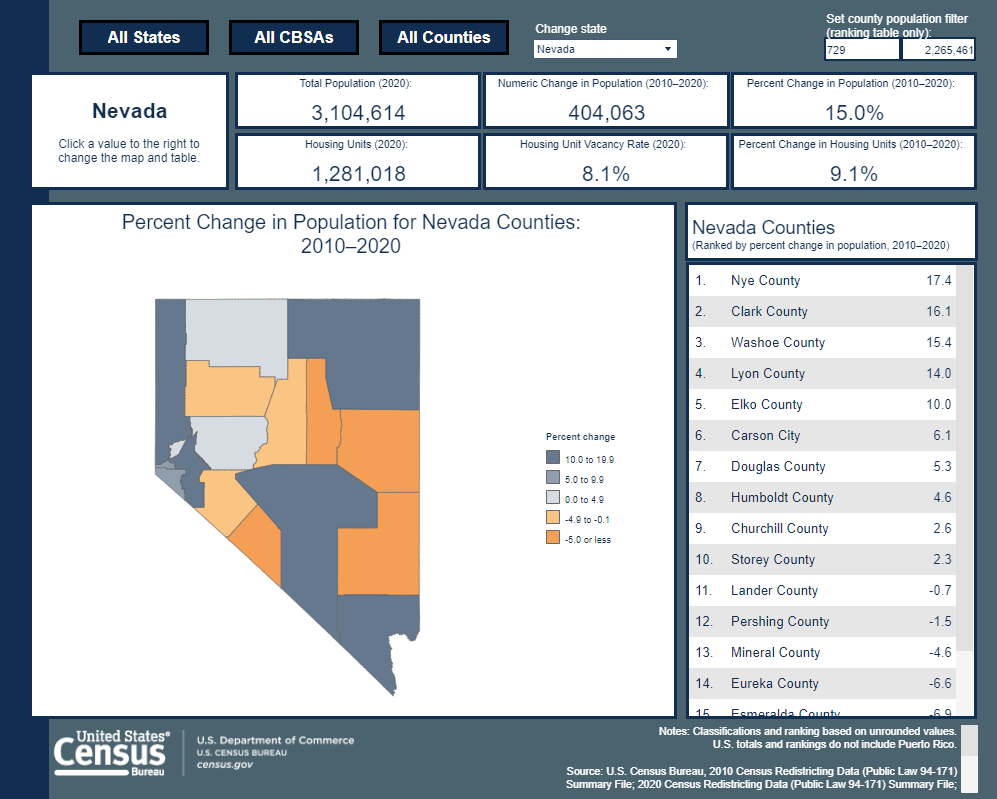
5. Nevada Top Counties
- Nevada Incentives – warm weather, employment, strong economy, no income tax, low taxes, great food, diversity, beautiful landscape, outdoor activities, cost of living and entertainment.
Now, let’s look at the top counties people are moving to in the entire U.S.
Although, the state level show trends, there are also county level trends within each state.
Let’s see the results.
County Level Population Trends from 2010 to 2020
We can see that North Dakota and Texas, who were withing the top five for population increases by state, are also in the top five for county population increases for the U.S.
We also see that 5 out of 10 of the top ten counties are in the south.
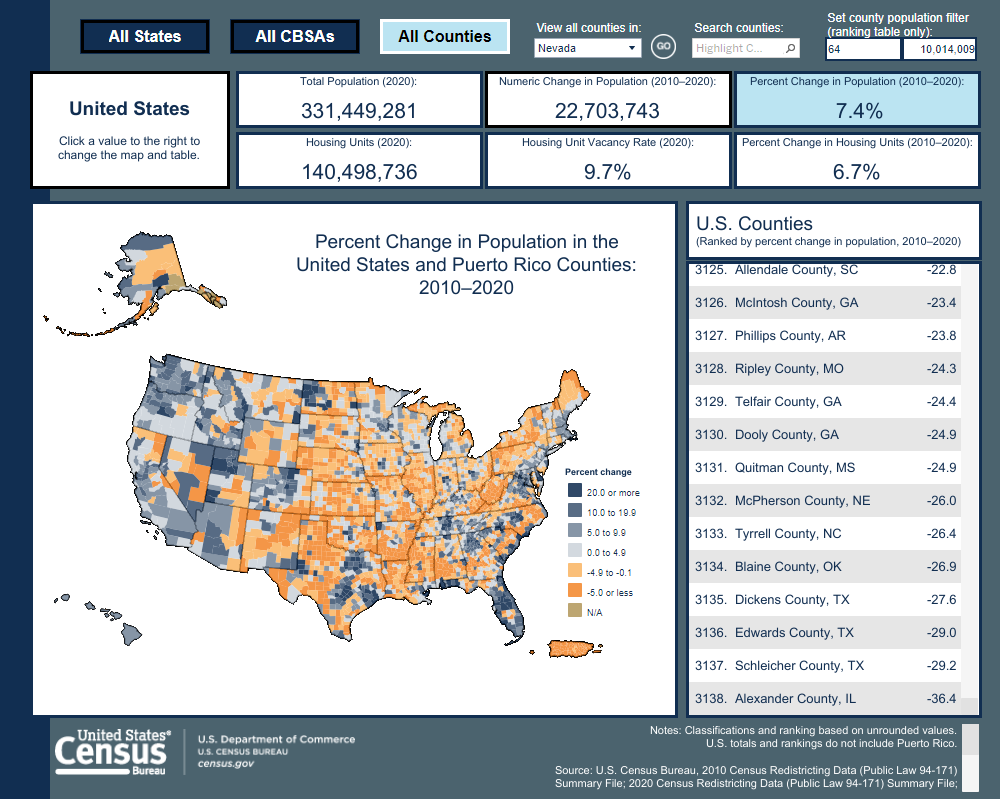
- Took a glimpse at the top counties people are also moving from below.
- Out of 3,138 counties, these counties have the highest populations that have left the county.
County-Level Decreasing Population Trends from 2010 to 2020
Conclusion
It is important to use data to keep up with changes and to also know why those changes are taking place.
COVID-19 has increased the desire for more space and outdoor activities.
Each state has it’s incentives and the numbers show where people are interested.
Keep these things in mind while you’re shopping for your next real estate investments.
Thanks for joining us today faithful readers – future leaders.
Love ya and continue to strive for growth.
Please comment what state you like the most and why.
FREE Deal Analysis for Rental Property Calculator!
Our mission is to help others develop using our knowledge and services.
We cater to those looking to grow professionally.
Explore our tools, education and services.
