How is the Residential Real Estate Market Trending Today?
What is the current state of the economy as it relates to residential real estate?
With inflation, interest rate increases, the housing shortage, and more, we will provide some updates on the state of the economy in relation to residential real estate.
Today, we will share new residential construction, rental vacancy, construction spending and new residential sales as published from census.gov.
It is important to stay knowledgeable with current events and we are happy to be your source.
Data can be very helpful.
Knowing the current directional path, can help you better plan for the future.
Let’s get started.
Residential Construction
We will cover a few statistics as reported from the most current data published by census.gov.
This data is for October 2022 or September 2022 as per the data available from census.gov.
In relation to residential construction, we will cover the categorized stages of; permits, authorized but not started, starts, under construction and completions.
Note: All units are in thousands.
Permits –
As shown below, we can conclude that;
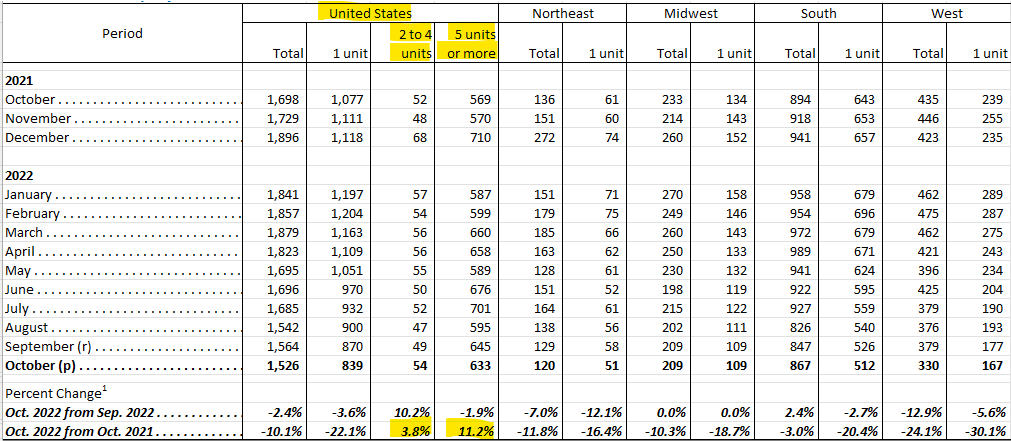
- Across the United States, there is an increase in approved permits for multifamily compared to last year.
- Multifamily permits are up 3.8% for 2-4 units and up 11.2% for 5 units or more.
- Single-family, on average, is down overall compared to last year.
- Multifamily is up overall across each region. This is indicated by the total amount being more than the data for single families or “1 unit”.
Authorized But Not Started –
As shown below, we can conclude that;
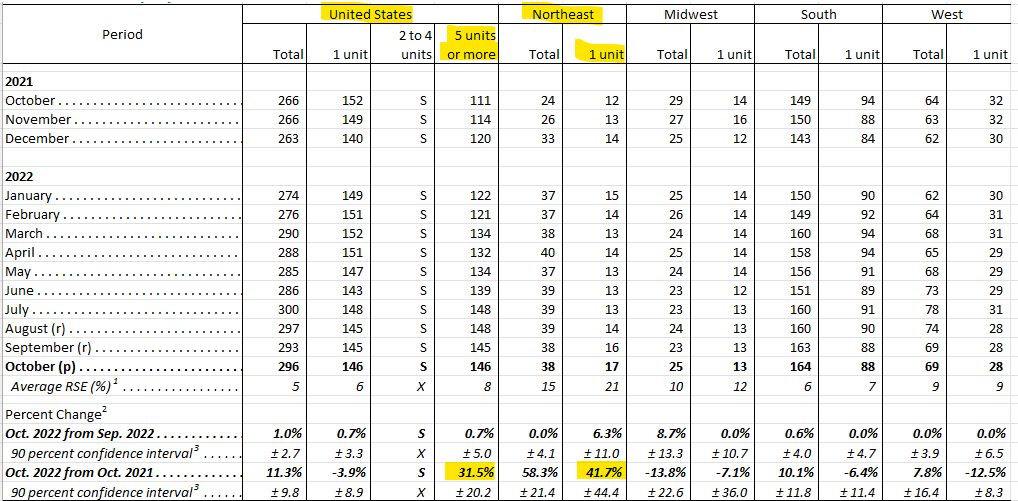
- Construction has been authorized primarily for commercial apartments.
- Construction has been authorized for single family residences in the northeast by 41.7% more than this time last year.
- All other regions do not have increases compared to last year.
- Single-family, on average, is down overall compared to last year.
- Except for the Midwest, multifamily is up overall across each region. This is indicated by the total amount being more than the data for single families or “1 unit”.
Starts –
As shown below, we can conclude that;
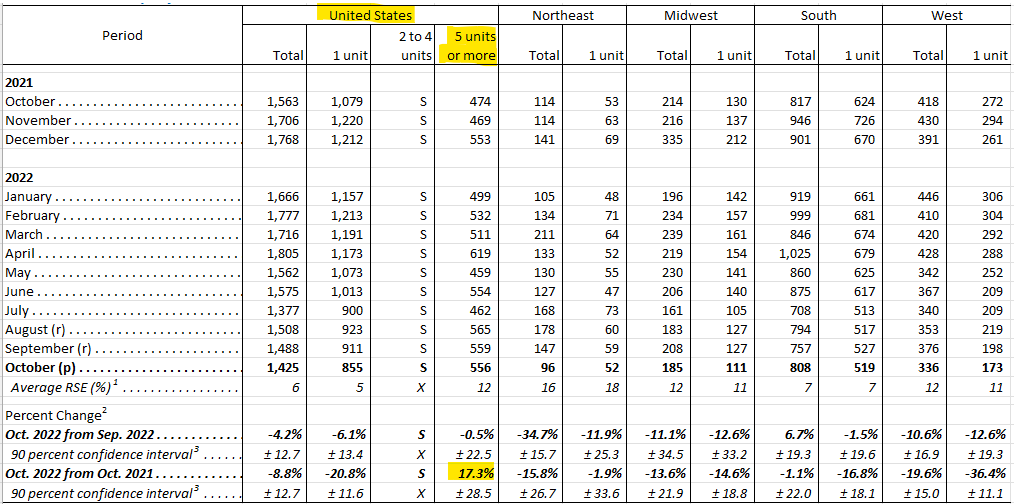
- Construction has started and is up by 17.3% in the United States for commercial apartments only.
- Single-family, on average, is down overall compared to last year.
- Multifamily is up overall across each region. This is indicated by the total amount being more than the data for single families or “1 unit”.
Under Construction –
As shown below, we can conclude that;
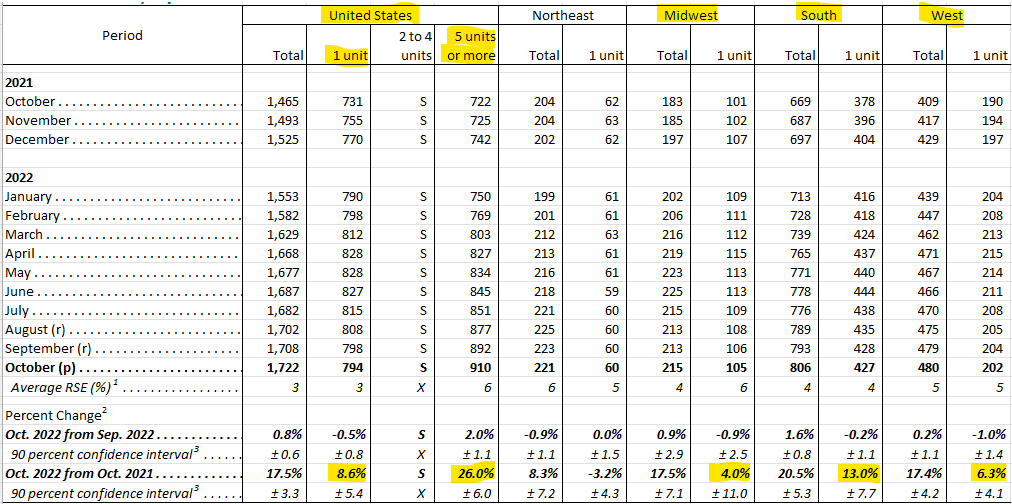
- In the United States single family and commercial apartments under construction is up 8.6% and 26% respectively compared to last year.
- The Midwest has single family units under construction at 4% higher than last year.
- The South has single family units under construction at 13% higher than last year.
- The West has single family units under construction at 6.3% higher than last year.
- Single-family, on average, is down overall compared to last year.
- Multifamily is up overall across each region. This is indicated by the total amount being more than the data for single families or “1 unit”.
Completions –
Note: (X) means not applicable, (S) means does not meet publication standards because tests for identifiable and stable seasonality do not meet reliability standards.
As shown below, we can conclude that;
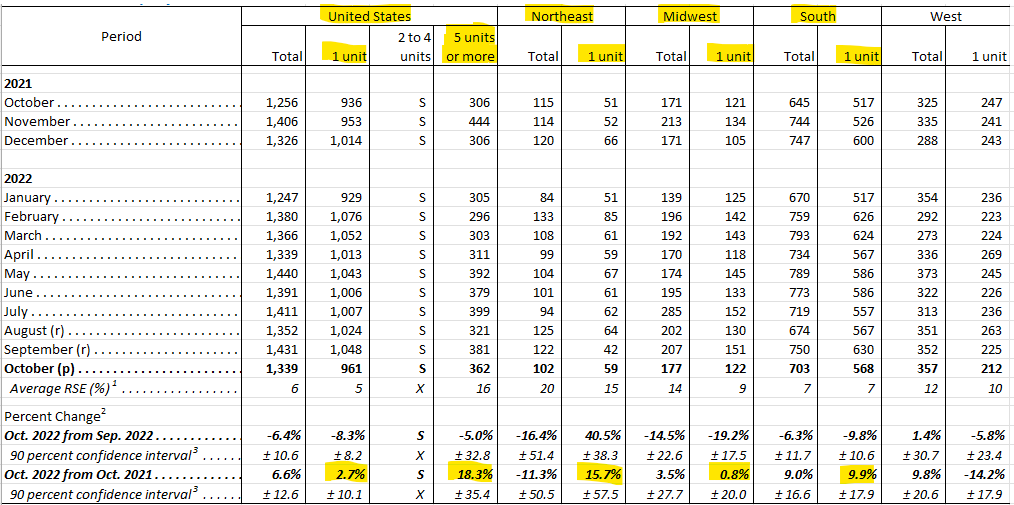
- The United States has completed more construction for single family and commercial apartments by 2.7% and 18.3% respectively.
- The Northeast has single family units completed at 15.7% higher than last year.
- The Midwest has single family units completed at 0.8% higher than last year.
- The South has single family units completed at 9.9% higher than last year.
- Except for the South, single-family, on average, is down overall compared to last year.
- Except for the South, multifamily is up overall across each region. This is indicated by the total amount being more than the data for single families or “1 unit”.
Rental Vacancy
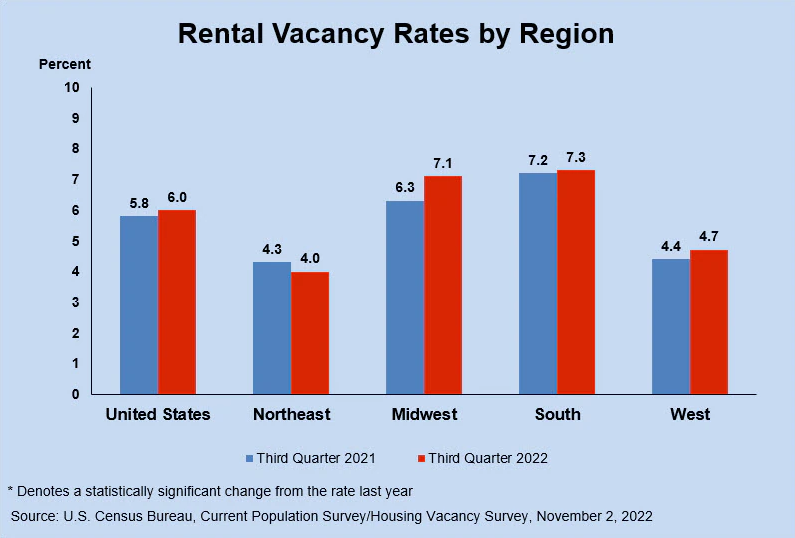
As shown below, we can conclude that;
- National vacancy rates in the third quarter 2022 were 6.0 percent for rental housing and 0.9 percent for homeowner housing.
- The rental vacancy rate was not much different from the rate in the third quarter of 2021 or 5.8 percent.
- The Midwest has the most significant increase in vacancy rates compared to last year.
- The Northeast is the only region to have a decrease in vacancy rates.
Now, let’s take a look at the trajectory of rent rates.
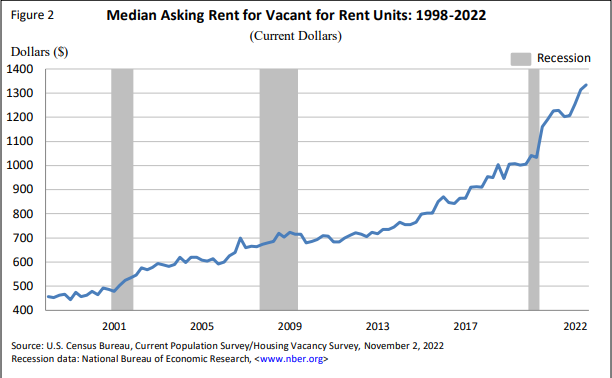
- One could argue that due to the rapid increase in rent rates, consumers are finding other options causing the vacancy rates to show increases for the first time in a few years.
Median Asking Rent for Vacant for Rent Units: 1998 – 2022
As shown below, we can conclude that;
The rental vacancy rate has rose 0.2% nationally compared to last year.
We can also see that rent rates have substantially increased from last year.
- See more data on the vacancy statistics by region in the Press Release for Rental Vacancy Rate data here.
Construction Spending
As shown below, we can conclude that;
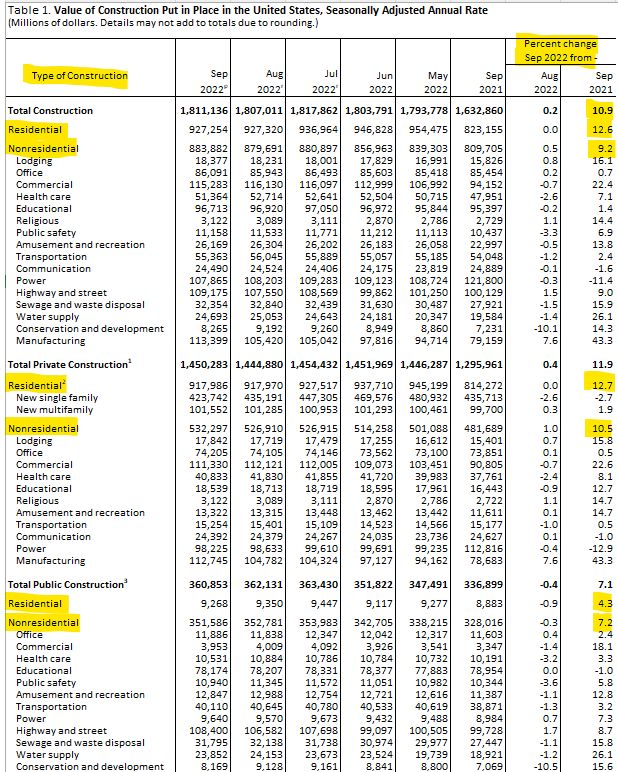
- On average, residential and non-residential construction is close to being split evenly except for in the public sector where non-residential is incrementally more than residential construction.
- Residential construction overall is 10.9% more than last year.
- The multifamily sectors of construction leads the way for all residential construction to date.
New Residential Sales
In this section, we will share the statistics that are for; sold and for sale, sold by sales price and stage of construction.
Sold and For Sale –
Note: (X) means not applicable.
As shown below, we can conclude that;
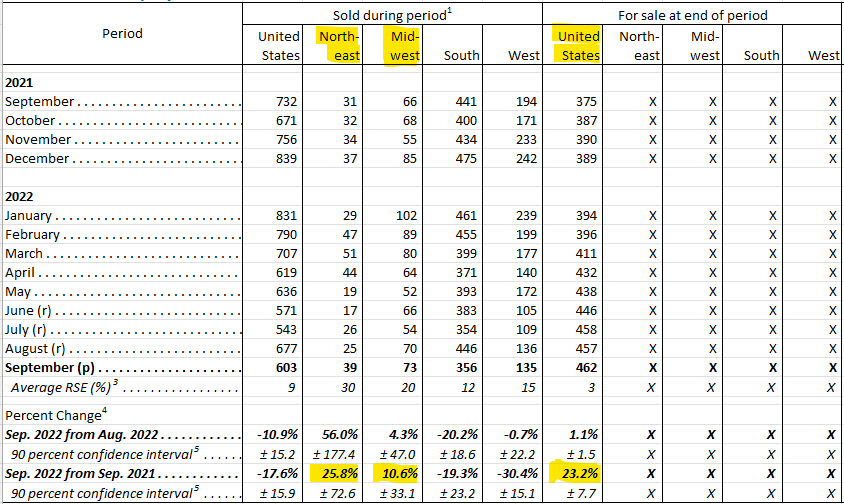
- From the data below, we can see that the Northeast and Midwest have sold, or had for sale, more units than last year by 25.8% and 10.6% respectively.
- The United States had 23.2% more units for sale, or that has sold, than last year.
Sold by Sales Price –
As shown below, we can conclude that;
Note: Any category with a (Z) was 500 units or less. All other units are in thousands.
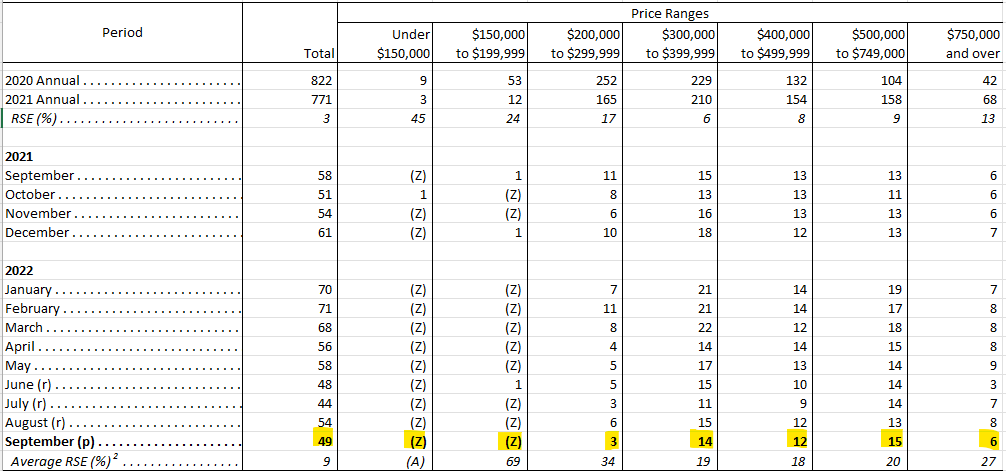
- Less units are selling on average, by their sales price than in previous months.
- Less units are selling overall on average, are selling than in previous months and compared to last year.
Stage of Construction –
As shown below, we can conclude that;
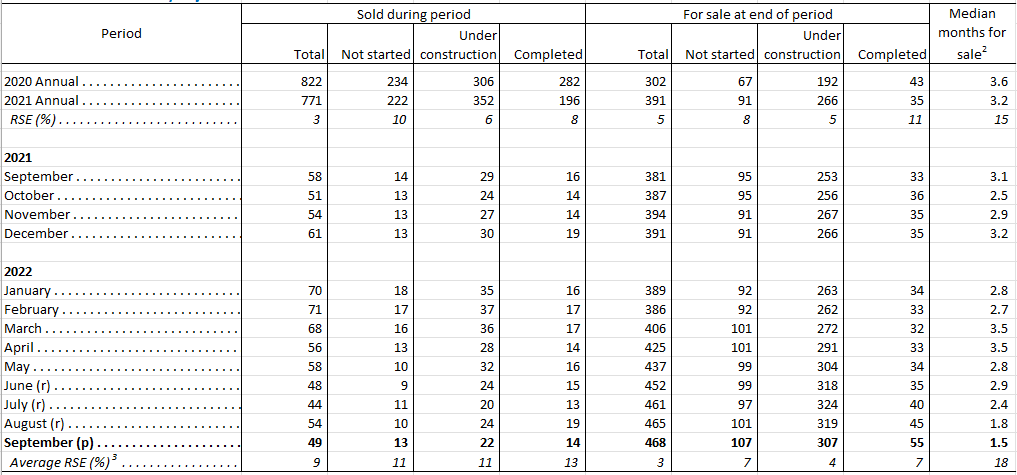
- Less units are started, under construction and completed, compared to previous months and last year.
- More units are for sale, on average, compared to previous months and last year.
We hope this information has been helpful.
Thanks for joining us faithful readers – future leaders.
Love ya and continue to strive for growth.
Please comment your thoughts of the data shared today.
FREE Deal Analysis for Rental Property Calculator!
Our mission is to help others develop using our knowledge and services.
We cater to those looking to grow professionally.
Explore our tools, education and services.
